
Page 33 - THE 14th GRADUATE INTEGRITY : GI14
P. 33
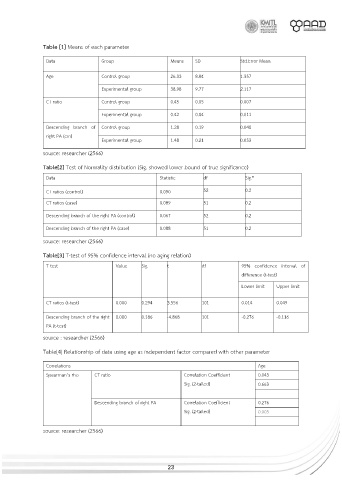
5BCMFǰ< > Means of each parameter

                 Data                Group                   Means    SD              Std.Error Mean


                 Age                 Control group           26.33    8.84            1.357

                                     Experimental group      38.98    9.77            2.117

                 CT ratio            Control group           0.45     0.05            0.007
                                     Experimental group      0.42     0.04            0.011

                 Descending branch  of  Control group        1.28     0.19            0.040
                 right PA (cm)
                                     Experimental group      1.48     0.21            0.033

                source: researcher (2566)

                5BCMF< > Test of Normality distribution (Sig. showed lower bound of true significance)
                 Data                                    Statistic       df             Sig.*

                 CT ratios (control)                     0.090           52             0.2

                 CT ratios (case)                        0.089           51             0.2

                 Descending branch of the right PA (control)   0.067     52             0.2
                 Descending branch of the right PA (case)   0.088        51             0.2

                source: researcher (2566)

                5BCMF< > T-test of 95% confidence interval (no aging relation)

                 T-test                   Value    Sig.     t           df            95% confidence interval of
                                                                                      difference (t-test)
                                                                                      Lower limit   Upper limit


                 CT ratios (t-test)       0.000    0.294    3.556       101           0.014        0.049

                 Descending branch of the right  0.000   0.186   -4.868   101         -0.276       -0.116
                 PA (t-test)
                source : researcher (2566)


                Table[4] Relationship of data using age as independent factor compared with other parameter

                 Correlations                                                               Age
                 Spearman’s rho   CT ratio                        Correlation Coefficient   0.043
                                                                  Sig. (2-tailed)           0.663

                                  Descending branch of right PA   Correlation Coefficient   0.276
                                                                  Sig. (2-tailed)           0.005

                source: researcher (2566)


                                                            23